 SignageTube
Put output, scrap, OEE and targets on the factory floor in numbers everyone can read. With Enterprise the dashboard updates itself from Excel, your databases or your machines.
See pricing per screen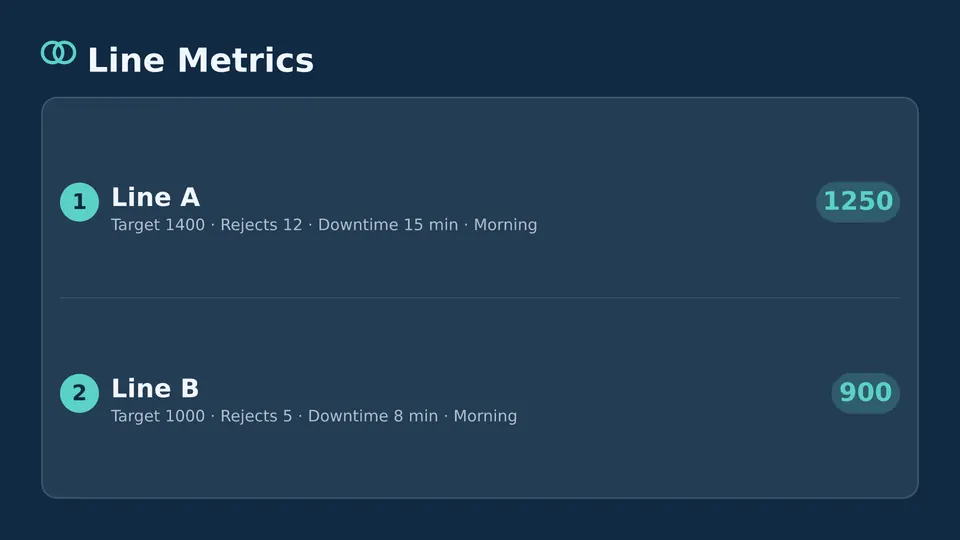
Start from a ready made Live Page, change the text, publish.
Per line and per shift, so the team sees where it stands.
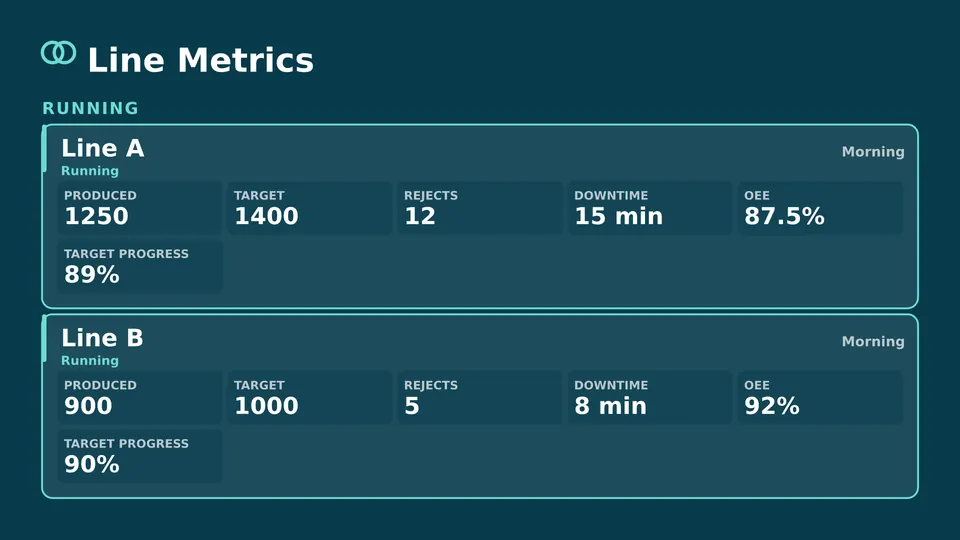
Availability, performance and quality on one production KPI dashboard.
First pass yield and scrap rates, updated through the day.
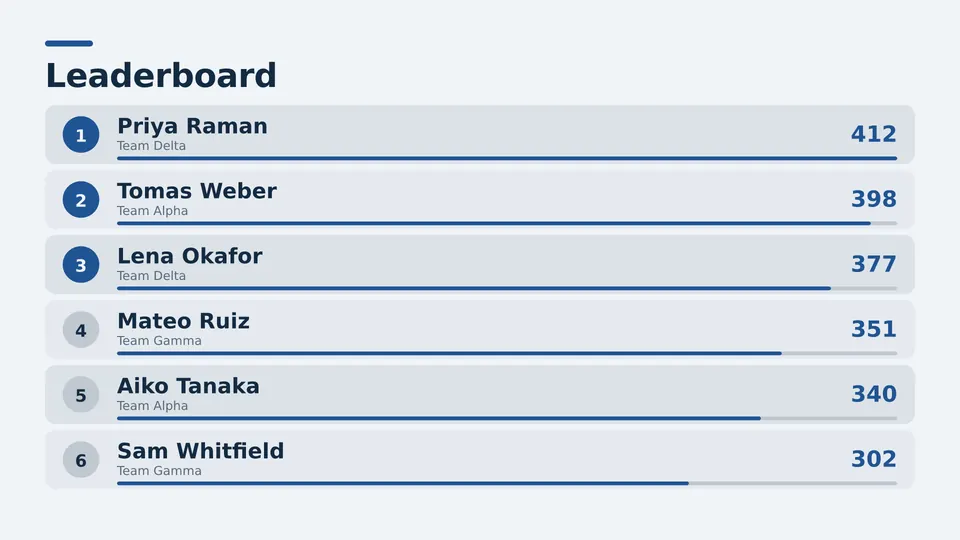
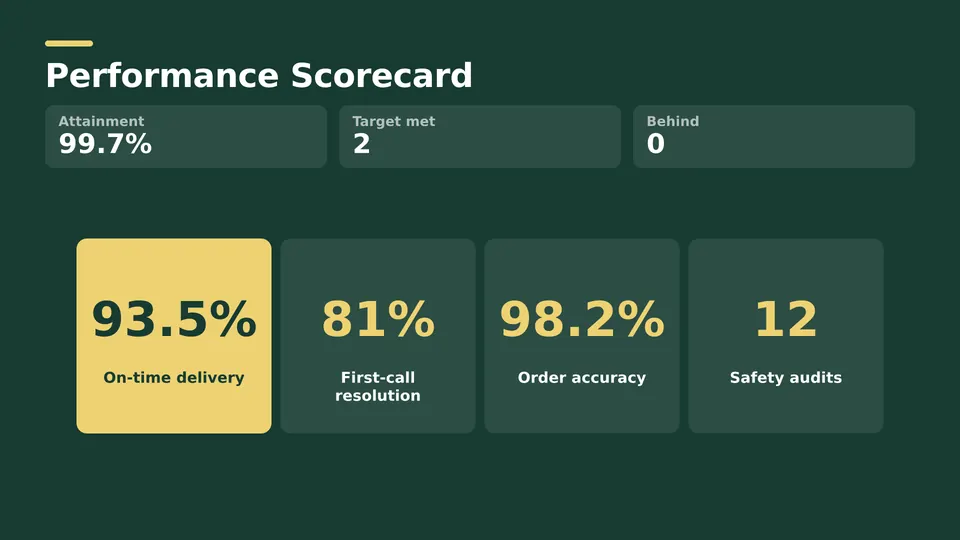
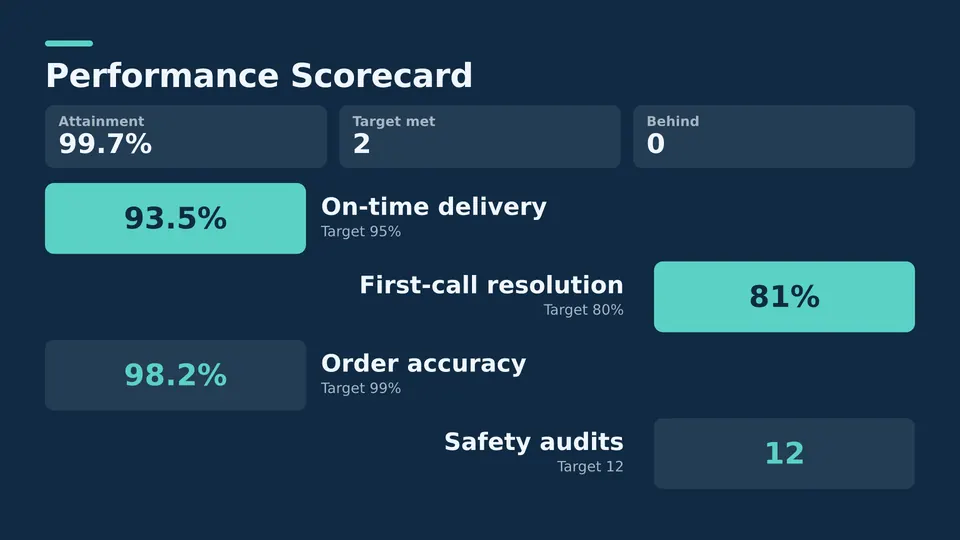
Which line or shift is ahead this week.
A KPI dashboard on the wall closes the loop. When the line can see the numbers, it can react during the shift, not after the report.
Live KPI dashboards need Enterprise: it connects to Excel, text files, SQL and other databases, OPC and 20+ sources. Starter can show KPIs you type in.
With Enterprise, SignageTube reads your Excel sheets, databases and other sources and updates the screen on its own. Change the number in the source and the screen follows.
Yes. Show availability, performance, quality and the resulting OEE per line, from the source you already use.
No. Start from a ready made KPI Live Page or your own PowerPoint layout and link it to your data.
Yes. With Custom, any edition runs on your own servers, from 5 screens.
Pick the edition you want to try for 15 days. No credit card, just your name and email.
Images, video, web pages, PowerPoint and Live Pages on any TV. The easiest place to start.
Start Starter trial →Real PowerPoint on Windows, a report of what played (Proof of Play) and a Control Room for all your screens.
Start Professional trial →Live data from Excel, databases and 20+ sources, screen health alerts and switching screens on and off.
Start Enterprise trial →Not sure? Start with Starter. You can move up any time.
Both come with a 15 day free trial. No credit card, just your name and email.