 SignageTube
RSS Weather Feed Digital Signage: Turn Live Forecasts into Eye-Catching Screens
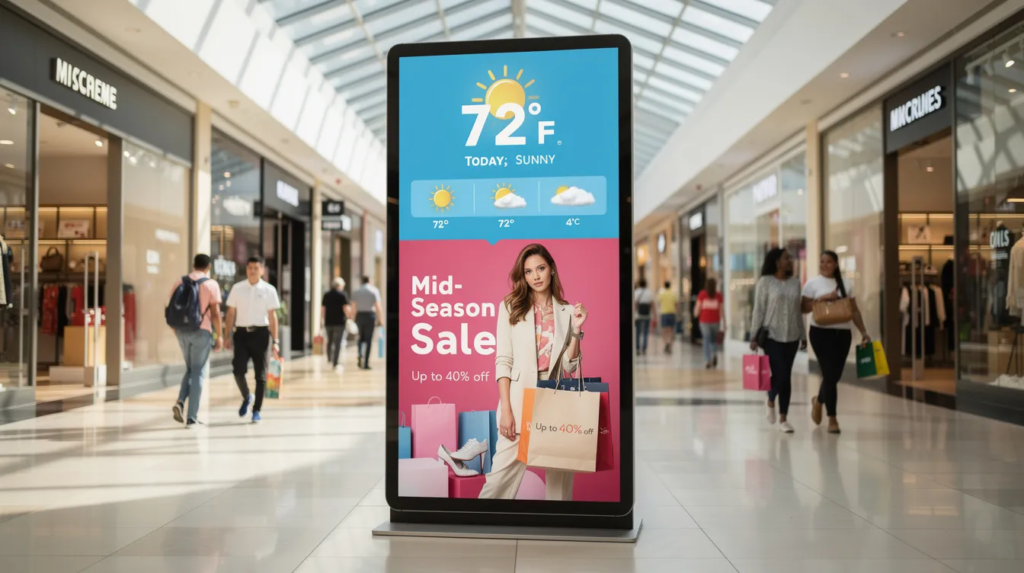
Introduction to Digital Signage for Managers, IT Professionals, and Business Owners
Are you a digital signage manager, IT professional, or business owner looking to keep your screens fresh and relevant? Automating weather content is a proven way to boost engagement and reduce manual work. This article explains how to use RSS weather feed digital signage to automate live forecasts on your screens, ensuring your audience always sees up-to-date weather information without the hassle of daily updates.
Quick Summary: Why Integrate RSS Weather Feeds with Digital Signage?
Integrating an RSS weather feed into your digital signage ensures your screens always display current weather information with automated, real-time updates. This process typically involves selecting a CMS with widget support and configuring the app or widget to display the data, reducing manual content management.
Digital signage managers, IT professionals, and business owners benefit from this automation by saving time, improving content relevance, and enhancing the viewer experience across all locations.
What is RSS Weather Feed Digital Signage?
RSS weather feed digital signage refers to the process of pulling live weather data from RSS feeds and displaying it automatically on digital screens in offices, retail spaces, campuses, and public areas. Using RSS weather feeds in digital signage offers real-time, automated updates, enhancing viewer engagement in lobbies, retail stores, and public spaces. Integrating real-time weather data into digital signage enhances content relevance and engagement. Digital signage can display dynamic content based on real-time weather updates. Weather data integration allows digital signage to adapt content based on current conditions.
Unlike static weather images or manually updated graphics, this approach polls data sources every few minutes, ensuring your screen always shows current weather data.
Key benefits at a glance:
- Always-current forecasts without daily uploads
- Location-specific relevance for your audience
- Low-maintenance automation that frees your team
Digital signage solutions also enable users to control content and optimize operations across various environments, such as control rooms, airports, and museums, especially when they use real-time digital signage solutions connected to live data sources.
Concrete examples include a 7-day forecast for New York City, a live temperature ticker for London, or severe weather alerts for the US Midwest—all pulled from various sources like NOAA, OpenWeather-based feeds, or national meteorological services.
Transitioning from understanding what RSS weather feed digital signage is, let’s explore how these feeds work with your digital signage system.
How RSS Weather Feeds Work with Digital Signage
RSS (Really Simple Syndication) is an XML-based protocol that weather providers use to publish updates every few minutes. Your digital signage CMS polls specific weather RSS URLs at intervals of 5–10 minutes, parsing fields like temperature, condition descriptions, wind speed, and alert messages.
The flow works like this:
- Source: Weather service generates the RSS feed.
- URL: You obtain the feed URL for your location—official websites of transportation agencies or weather services often provide access to RSS feeds and APIs.
- CMS: Your software ingests and parses the data.
- Screen: Visual template displays the weather information.
Each playlist can subscribe to different feeds. For example, one feed for Berlin, another for Madrid, and another for Chicago—all updating independently. Providers like Environment Canada offer location-specific RSS endpoints for Canadian locations. Some providers also offer APIs and cloud-based platforms for real-time synchronization, content security, and global accessibility.
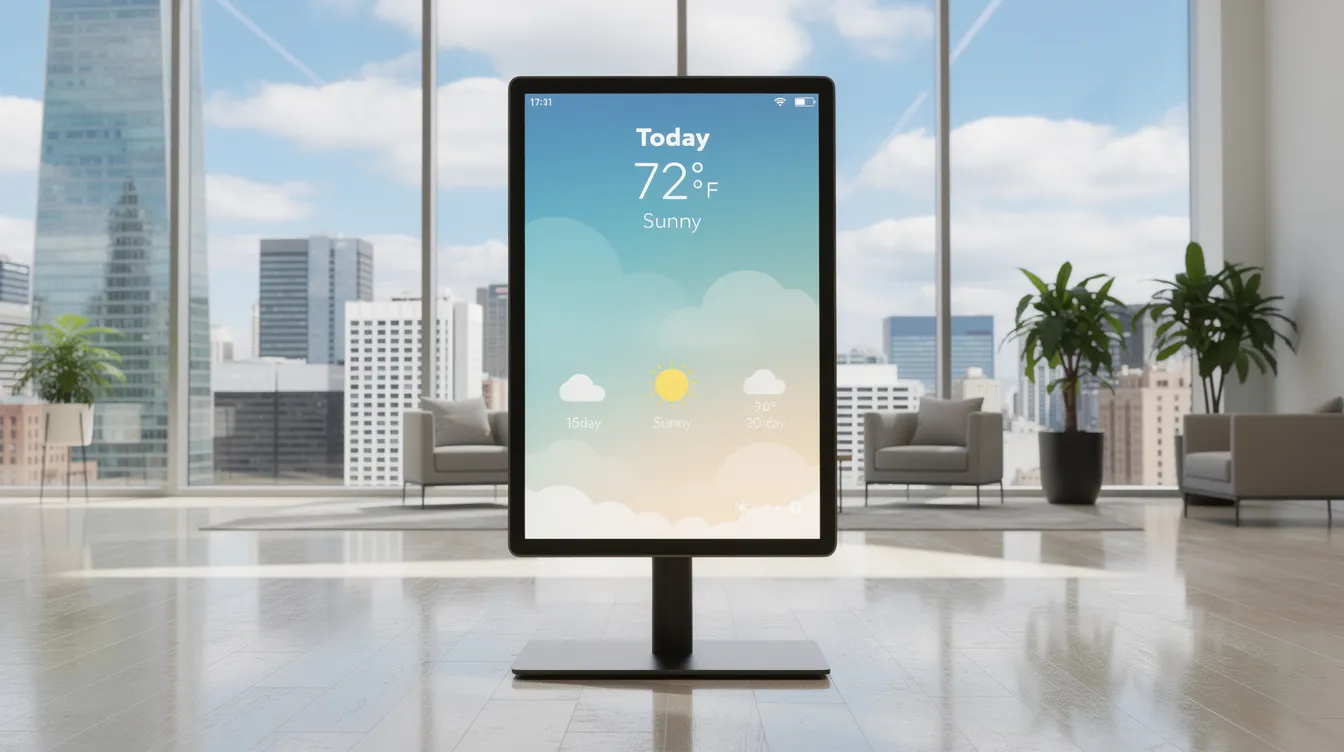
Now that you know how RSS weather feeds integrate with digital signage, let’s examine the benefits of automating weather content.
Benefits of Using RSS Weather Feeds on Digital Signage
Engagement Benefits
Weather content drives real engagement in high-traffic areas. Fresh visuals keep viewers checking your display, and audiences use forecasts to plan commutes and activities. This practical value ensures your screens remain relevant and useful.
Automation Advantages
Automated updates mean no more daily image uploads for your team. Hyperlocal content ensures relevant updates for each specific location, and promotional tie-ins allow you to combine weather with offers for maximum impact.
A quick service restaurant can upsell hot drinks when temperatures drop below 5°C. An office lobby can show commute-relevant forecasts for the next 12 hours. This dynamic content approach reduces manual work while delivering value customers actually use.
Now that we’ve covered the benefits, let’s look at the types of weather content you can display.
Typical Weather Content You Can Show from RSS Feeds
Modern weather RSS feeds carry more than just temperature. You can access and display:
- Current temperature
- “Feels like” value
- Condition icon (e.g., sunny, cloudy, rain graphics)
- Wind speed and direction
- Humidity
- Severe weather alerts
Consider layouts like a 3-day forecast bar for Paris with icons and highs/lows, a “Now / Next 6 hours” strip for Tokyo, or a vertical 5-day stack for Chicago. Many feeds support severe weather alerts that you can highlight with color-coded banners.
Display Examples Table:
|
Data Type |
Display Example |
|---|---|
|
Current temperature |
Large 80-120px font, center screen |
|
“Feels like” value |
Smaller text below temperature |
|
Condition icon |
Sunny, cloudy, rain graphics |
|
Wind speed/direction |
Secondary detail panel |
|
Humidity |
Percentage badge |
|
Severe alerts |
Color-coded banner or ticker |
Next, let’s walk through how to set up RSS weather feeds in your digital signage system.
Setting Up RSS Weather Feeds in Your Digital Signage System
To integrate an RSS weather feed into your digital signage, you typically need to obtain a weather RSS URL and add it to your signage software’s RSS widget. Many modern CMS platforms provide dedicated weather apps that are often more reliable than raw RSS feeds, which can sometimes result in formatting errors.
Here’s a quick step-by-step for the first time you configure weather content, which mirrors many of the basics of getting started with real-time digital signage:
- Choose a provider: Select a weather service with RSS support (BBC, NOAA, OpenWeather endpoints).
- Obtain the URL: Get the feed URL for each city or ZIP code.
- Verify frequency: Check that updates occur every 10–30 minutes.
- Add to CMS: Create a weather data source and paste the URL.
- Map fields: Connect RSS fields to template placeholders.
- Test preview: Verify data renders correctly.
For multiple feeds, configure playlists showing London, Manchester, and Edinburgh in rotation on a UK retail network. Set a cache time of 5–15 minutes to respect rate limits, and add a fallback message like “Weather data temporarily unavailable” if the feed fails.
With your feeds set up, it’s time to focus on design best practices for weather-based digital signage.
Design Best Practices for Weather-Based Digital Signage
Design Tips for Legibility
Viewers only glance at screens for 2–5 seconds. Design for legibility by using large fonts for temperature (80–120px on 1080p), keeping humidity and wind in smaller secondary text, and choosing universally recognizable icons. Apply color coding: blue for cold, orange/red for heat, gray for clouds.
Environment-Specific Layouts
- Landscape dashboards for corporate rooms
- Portrait totem layouts for malls
- Ticker-style ribbons for transport hubs
Customize by adding your company logo or a promotion tied to the current forecast.
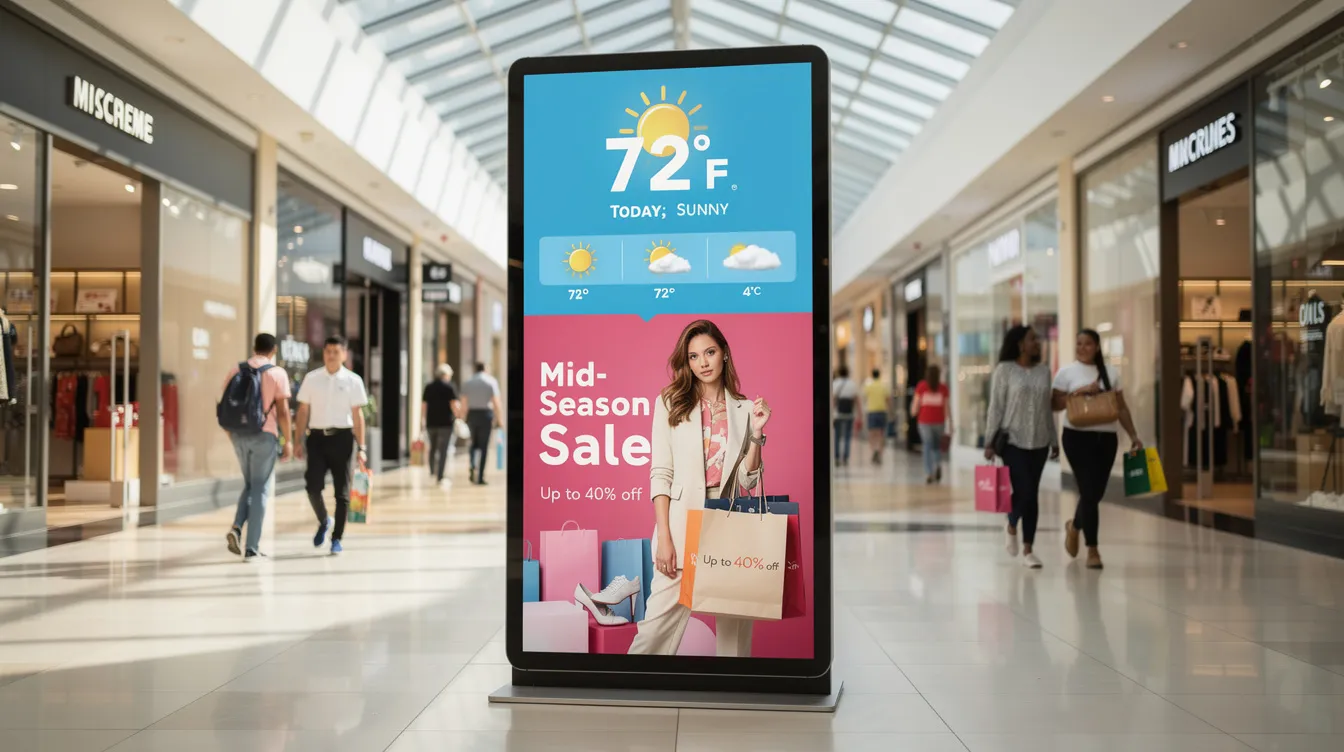
Once your design is optimized, you can take your content to the next level with automation.
Automating Content with Weather-Triggered Rules
Advanced platforms let you leverage RSS weather fields as triggers for conditional content, turning your screens into dynamic real-time content displays. Build rules in your CMS:
- Temperature < 5°C: Show hot beverage offers
- Temperature > 25°C: Advertise sunglasses and cold drinks
- Condition contains “rain”: Push indoor activity promotions
- Tomorrow’s forecast includes “snow”: Schedule winter safety tips today
This automation increases relevance without adding daily workload. You define the trigger once, and the system handles the rest.
With automation in place, let’s see how different industries are using RSS weather feed digital signage in real-world scenarios.
Industry Use Cases for RSS Weather Feed Digital Signage
Retail: Clothing stores switch window creatives based on live temperature—coats on cold days, swimwear when it’s hot.
Hospitality: Hotels display 5-day forecasts, ski conditions, or beach weather in lobbies, helping clients plan activities.
Corporate: Offices show local weather alongside KPIs and news, helping commuters while reinforcing community communications.
Education: Universities use weather feeds on wayfinding kiosks to inform students about rain, snow, or heat warnings.
Transport: Bus and train stations show forecasts and real time alerts, while city-wide billboards adapt ads based on conditions.
Livesignage adapts to any environment, driving engagement, efficiency, and growth.
Now that you’ve seen practical applications, let’s discuss how to choose the right weather RSS sources and ensure data quality.
Choosing Weather RSS Sources and Checking Data Quality
Not all feeds deliver equal quality. Compare providers on:
- Refresh rate (every 5 vs 30 minutes)
- Geographic coverage and language support
- Inclusion of forecast and alert data
- Licensing for commercial or publicly displayed signage
Testing over 24–48 hours reveals consistency issues before you scale to critical displays like airports. Check whether attribution or a provider logo is required on screen.
With reliable sources in place, consider performance and reliability for your network.
Performance, Bandwidth, and Reliability Considerations
Weather RSS feeds are lightweight, but large networks need smart management to keep real-time signage data flows reliable:
- Use centralized caching so one device fetches data for many players
- Set polling intervals of 5–15 minutes to balance freshness with limits
- Display “Last updated at 10:05” if connectivity drops
- Create monitoring alerts if a feed hasn’t updated in 60 minutes
This secure approach keeps your signage network reliable without overwhelming provider APIs.
Next, let’s explore how mobile and AI-powered signage are shaping the future of digital displays.
Mobile and AI-Powered Signage
The rise of mobile and AI-powered signage is transforming how organizations connect with their audiences. By integrating mobile devices and artificial intelligence, digital signage becomes more interactive and responsive, allowing users to access content and information wherever they are.
AI-powered signage can automate content updates by pulling data from weather APIs, social media feeds, and other sources, unlocking instant real-time digital signage updates that ensure displays always show the most relevant information. These advanced solutions work seamlessly with existing digital signage software, enabling users to create, schedule, and manage content from a unified platform.
The result is a smarter, more efficient way to deliver timely updates and engaging experiences to viewers, all while reducing manual effort.
With these innovations, it’s important to measure the impact of your digital signage strategy.
ROI Tracking and Analytics
Measuring the impact of your digital signage is crucial for ongoing success, especially when you are tracking the benefits of real-time digital signage on engagement and efficiency. With built-in analytics and reporting tools, digital signage software allows users to track key engagement metrics such as views, clicks, and interactions.
This data provides valuable insights into how audiences are responding to your content, helping you refine your messaging and maximize ROI. By leveraging these analytics, businesses and organizations can make informed, data-driven decisions to optimize their digital signage campaigns, improve engagement, and achieve their communication goals.
Effective ROI tracking ensures that every piece of content displayed on your signage is contributing to your overall strategy.
Let’s look at some real-world examples of how organizations are succeeding with RSS weather feed digital signage.
Case Studies and Examples
Digital signage is making a difference across a wide range of industries, and many organizations are now getting started with real-time digital signage to power these use cases.
For example, retail stores use digital signage to create and display promotional offers that drive sales, while hospitals rely on signage to provide wayfinding and real-time patient updates. In public spaces like airports and shopping malls, digital signage delivers both information and entertainment, enhancing the overall experience for visitors. Restaurants are adopting digital menus that can be updated instantly, and educational institutions use signage to keep students informed about campus events and weather conditions.
These real-world examples highlight how digital signage solutions enable organizations to create engaging, interactive content that meets the needs of their audiences and supports their business objectives.
Looking ahead, let’s explore future trends in digital signage and weather data integration.
Future Trends: Beyond Basic RSS Weather Feeds
By 2026, digital signage is evolving toward richer, data-driven experiences. Expect to see:
- Multi-layer dashboards: Combining weather with traffic, events, and streaming sales data
- AI-assisted layouts: Systems auto-selecting templates based on conditions and audience patterns
- Hyperlocal sensors: Rooftop temperature readings displayed alongside regional forecasts
- Cinematic animations: AI-curated summaries with city-unique visuals
Organizations that build well-structured RSS weather integrations now will be positioned to adopt these advanced capabilities as the world of digital signage continues its growth.
Key Takeaways
- RSS weather feed digital signage automates live forecasts on your screens.
- You can create location-specific content for multiple cities from a single CMS.
- Weather-triggered rules let you deliver contextual promotions without manual work.
- Test your source feed for 24–48 hours before scaling to production.
Start with one feed on a single screen. Learn what works, check your articles and blog posts for inspired promotional tie-ins, then repeat the process across your network. The view from here? Fresh, engaging weather content that runs itself.
- SignageTube Starter – content signage on any TV
- SignageTube Enterprise – live data on your screens
- Digital signage software – how to choose, and what matters
- Templates – 120+ ready-made designs
- Pricing – simple per-screen plans