Enhance Business Visibility with Office TV Dashboard Solutions
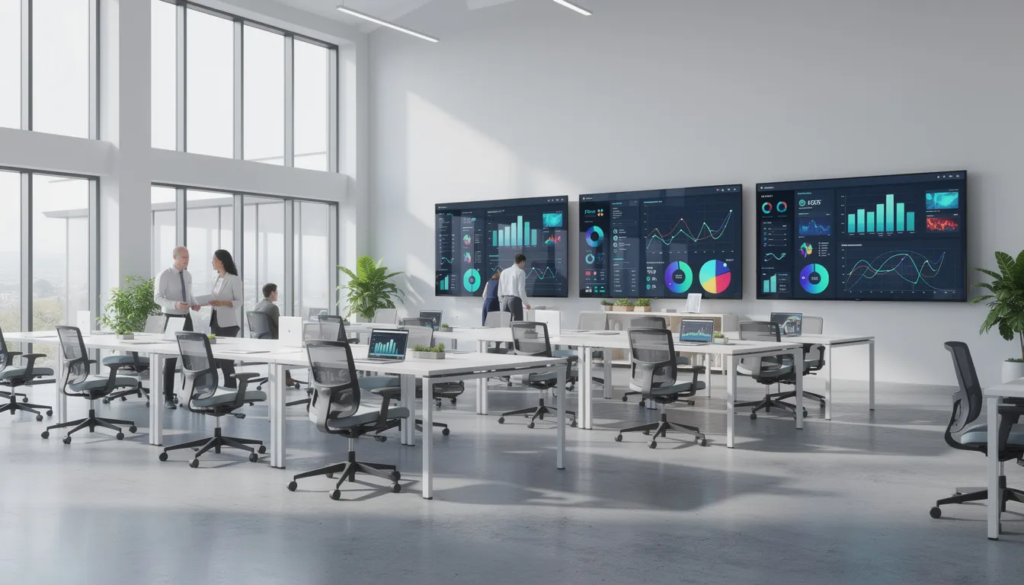
An office TV dashboard transforms a simple tv screen into a command center for your team’s most important metrics. Dashboard displays are the visual presentation of dashboards on screens, allowing real-time data sharing and easy monitoring for teams and organizations. Instead of forcing everyone to dig through spreadsheets, CRMs, or analytics tools, you surface key performance indicators on a large screen that anyone can read at just a glance.
A TV dashboard displays live data in a physical space, such as an office or warehouse.
This guide walks you through everything you need to know about setting up, securing, and scaling office TV dashboards in 2025—from hardware selection to software choices to practical use cases for different departments. In an office setting, TV dashboards are designed for passive, at-a-glance consumption by entire teams simultaneously, and serve as centralized displays for real-time KPIs, sales figures, and project metrics.
Key Takeaways
- An office tv dashboard is a wall-mounted display that shows live data, KPIs, and internal content in shared spaces, pulling from tools like Google Analytics, Salesforce, or HubSpot to keep your whole team informed without requiring everyone to log into separate systems.
- A robust setup combines three layers: the right TV hardware (commercial or consumer displays), a media player or PC to run the dashboard, and dedicated dashboard display software rather than just casting a browser tab that crashes after a few hours.
- Core benefits for offices in 2025 include real time data tracking that correlates to 15-25% productivity gains in sales and ops teams, cross-team alignment through shared visibility, and fewer “where is that report?” interruptions—some organizations report 30-50% reduction in these queries.
- TV dashboards must be designed differently from desktop dashboards: bigger fonts (40-80pt headlines for 55-65” screens), fewer widgets (5-10 per view), and clearer layouts optimized for 3-5 meter viewing distance.
- This article covers hardware choices, software options, security best practices, step-by-step setup instructions, and concrete use cases for sales, marketing, support, engineering, and leadership teams.
What Is An Office TV Dashboard?
An office TV dashboard is a large screen, wall-mounted display that shows live data, KPIs, and internal content in shared office spaces. Rather than being just a dashboard designed for individual analysis, it serves as a passive, always-on information radiator that keeps metrics visible to everyone passing by.
These systems typically pull data from tools like Google Analytics, HubSpot, Salesforce, Zendesk, Monday.com, or SQL databases and visualize it in real time. The data automatically updates at set intervals—anywhere from every minute for operational metrics to every hour for slower-moving financial figures—so teams always see current information without manual refreshes, capturing many of the benefits of real-time digital signage for your business. Digital signage solutions are used to display dashboards and other web-based content securely and efficiently across various locations, and live data for digital signage with real-time updates, feeds, and dashboards is what transforms these screens from static posters into dynamic communication tools.
TV Dashboard vs Desktop Dashboard
The difference between a TV dashboard and a regular desktop dashboard comes down to viewing context:
|
Aspect |
Desktop Dashboard |
TV Dashboard |
|---|---|---|
|
Viewing distance |
50-70 cm |
3-5 meters |
|
Interaction |
Click, filter, drill-down |
Passive viewing only |
|
Complexity |
100+ elements, dense tables |
5-10 widgets maximum |
|
Font size |
10-14pt |
40-80pt headlines |
|
Session length |
Minutes at a time |
24/7 continuous display |
Typical locations for office TV dashboards include open-plan sales floors, marketing areas, operations rooms, reception areas, engineering war rooms, and warehouse or logistics hubs. Modern setups can display dashboards by rotating multiple dashboards on a single screen in timed loops—for example, cycling through sales, marketing, and support views every 30-60 seconds. TV dashboards can be set up to display multiple dashboards in a loop, acting like a slideshow. Digital signage CMS platforms like ScreenCloud and TelemetryTV are designed to loop multiple dashboards automatically, with looped dashboards scrolling from one to the next automatically, similar to how real-time digital signage setups are configured from scratch using familiar tools and automated updates.

Why Your Office Needs A TV Dashboard
Key Business Benefits
Global business data is projected to reach 181 zettabytes by 2025, making traditional email reports or BI logins increasingly inefficient for cross-team visibility. An office tv dashboard serves as a “source of truth” wall that surfaces critical metrics without forcing everyone to navigate complex analytics tools throughout the day.
Key business benefits include:
- Better focus on KPIs: When important metrics are visible on an office wall, teams naturally align their efforts toward those numbers rather than getting lost in secondary tasks.
- Faster detection of issues: Real-time visibility into pipeline stalls, support ticket backlogs, or SLA breaches prompts immediate action rather than waiting for weekly reports.
- More transparent performance culture: Public dashboards create accountability and shared understanding of how the business is performing.
Team-Specific Benefits
Different teams benefit in distinct ways:
- Sales reps see daily pipeline value and quota progress, staying motivated and aware of where they stand.
- Marketers monitor campaign ROAS and lead volume, catching underperforming ads before burning through ad budget.
- Support teams track SLAs and customer satisfaction score trends, enabling quick reallocation when queues spike.
Reducing Information Silos
One of the most significant advantages is reducing information silos. Instead of metrics living in scattered spreadsheets, CRMs, or analytics tools that only certain people access, everyone sees the same information on the wall. Teams stay on the same page without endless Slack threads asking for updates, especially when you use real-time digital signage platforms like SignageTube Live that automate those information flows.
Public recognition for wins—closed deals, NPS milestones, uptime streaks—also fosters healthy competition and motivation. Studies from gamification platforms suggest that visible win celebrations can boost morale by approximately 20%.
Core Components Of An Office TV Dashboard Setup
A reliable office tv dashboard is a combination of four components: the screen, the player device, the dashboard software, and the network/security layer. Skipping any of these creates fragility—the classic “browser tab casting” approach fails precisely because it ignores the player and security layers.
The Screen
- The screen is usually a commercial display or consumer TV, typically 55-75 inches with 4K resolution, mounted in high-traffic office zones.
- Commercial displays offer longer duty cycles (rated for 16/7 or even 24/7 operation) and features like RS232 control for remote power management.
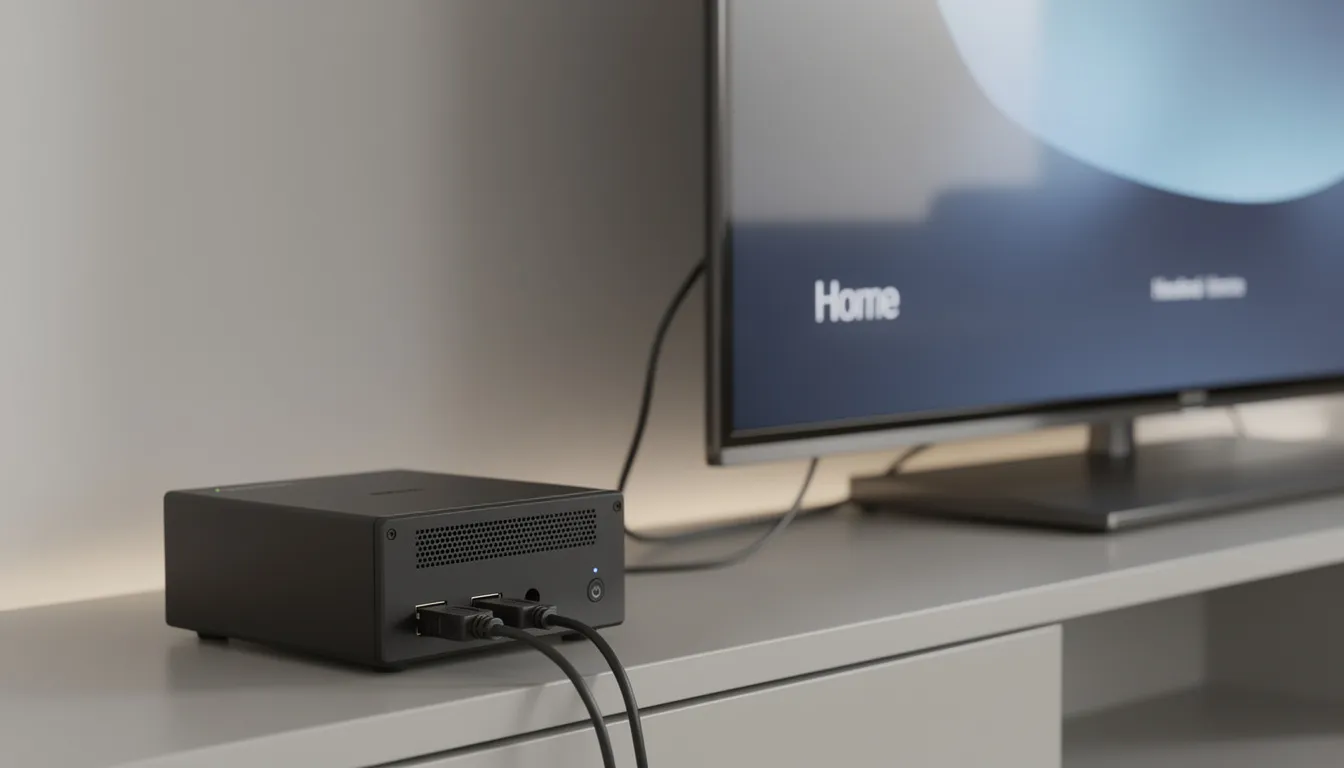
The Player Device
- The player device is a small computer or media device—such as a mini PC, Intel NUC, thin client, or Android box—that runs the browser or signage app connected to the tv display via the hdmi port.
- This is the component many offices overlook, assuming the TV’s built-in browser will suffice.
The Dashboard Software
Dashboard software operates on two levels:
- The data/dashboard layer: BI tools like Power BI, Looker, Tableau, Databox, or Geckoboard that create and visualize your metrics.
- The display/management layer: TV dashboard software or digital signage platforms that handle playlists, screen groups, and content rotation.
Network Requirements
- Stable internet or internal LAN access is required, along with connectivity to data sources, and secure authentication (SSO, VPN, or service accounts) to reach private dashboards.
- Most organizations run dedicated Ethernet to wall-mounted TVs to avoid Wi-Fi reliability issues.
Choosing The Right Hardware
Hardware choices affect reliability, cost, and maintenance effort, especially when scaling from one office TV to several floors or multiple locations. What works for a single screen in a startup might fail spectacularly when you’re managing 50 screens across three offices.
Choosing by Scale and IT Policies
- 1-3 screens: Repurposed office PCs or consumer-grade TVs can work for pilots.
- 10+ screens: Standardized media players and commercial displays justify the higher upfront cost through reduced maintenance.
- 50+ screens: Dedicated signage players with centralized management become essential.
Display Sizing Recommendations
|
Space Type |
Recommended Size |
Resolution |
|---|---|---|
|
Small meeting room |
49-55” |
4K UHD |
|
Open-plan pod |
55-65” |
4K UHD |
|
Large open floor |
75-86” |
4K UHD |
|
Reception/lobby |
55-75” |
4K UHD |
Practical considerations beyond size include fan noise from player devices, power cycling behavior after outages (does the TV auto-resume?), and remote management capabilities. Commercial displays rated for 50,000+ hours offer better reliability than consumer TVs that may suffer burn-in after 10,000 hours.
Hardware Setup Comparison
|
Setup Type |
Pros |
Cons |
Best For |
|---|---|---|---|
|
Smart TV only |
Cheapest, no extra devices |
Crashes after 4-8 hours, limited JavaScript support |
Quick pilots, static content |
|
TV + mini PC |
Full OS control, VPN/SSO support |
20-50W extra power, fan noise, update hassles |
Small deployments with IT support |
|
TV + dedicated player |
Silent, auto-kiosk boot, cloud management |
Higher per-device cost |
10+ screen deployments |
Using A PC Or Mini PC
Many offices start by connecting an old office PC, Intel NUC, or similar mini PC to a TV via HDMI and running a browser in full screen mode (kiosk mode). This approach offers significant flexibility and leverages existing IT infrastructure.
Advantages:
- Full OS control over browser settings, extensions, and configurations.
- Ability to run any browser-based dashboard without compatibility concerns.
- Easy VPN or SSO integration using existing corporate tooling.
- Works with existing IT management tools (RMM, antivirus, patching via Intune or similar).
Drawbacks:
- Windows or macOS updates trigger reboots that interrupt dashboard display.
- Requires configuring auto-login, browser auto-launch, and sometimes watchdog scripts.
- Risk that someone uses the device for other tasks and closes the dashboard.
- Fan noise (30-40dB under load) can be distracting in quiet areas.
Minimum specs for smooth 4K dashboard performance in 2025:
- 8 GB RAM (16 GB preferred for multiple tabs)
- 256 GB NVMe SSD storage
- Modern CPU (Intel i5+ or AMD equivalent)
- UHD Graphics supporting 60fps 4K output
Offices with strict compliance requirements—particularly in finance or healthcare under GDPR or HIPAA—often prefer domain-joined Windows machines or managed macOS mini PCs for predictable governance. Tools like Chrome’s –kiosk flag or Edge’s assigned access mode can lock down the browser session.
Smart TVs And Built-In Browsers
Most Smart TVs include web browsers (WebOS, Android TV, Tizen), but these are usually intended for casual use, not 24/7 dashboard operation. Treating them as your primary dashboard display method leads to reliability problems.
Limitations:
- Sluggish performance on complex dashboards with heavy JavaScript.
- Limited support for advanced charting libraries and animations.
- Unreliable full screen mode that may exit unexpectedly.
- Aggressive sleep and energy-saving behavior that turns off the display.
- Memory leaks causing crashes after 1-2 hours of continuous operation.
Testing reveals approximately 50% failure rates over 72-hour periods for Smart TV browsers displaying dynamic BI dashboards, compared to 5% failure rates for dedicated players.
If you must use a Smart TV’s built-in browser, keep dashboards extremely lightweight and static. Test thoroughly to ensure they refresh correctly after several hours without intervention. This approach works for a temporary pilot or a simpler dashboard showing a single view, but not as the backbone for a multi-screen office deployment.
For offices planning more than one dashboard screen or two, pair TVs with dedicated players for stability.
Dedicated Signage Players And Streaming Devices
Dedicated media players—such as Android TV boxes, ChromeOS devices, Raspberry Pi-class devices, or proprietary signage players—represent the scalable option for organizations serious about their office TV dashboard deployment.
Benefits:
- Low power usage (often under 10W compared to 50W+ for a regular laptop or mini PC).
- Silent operation with no moving fans.
- Auto-start into a kiosk app on power-up.
- Central remote control from an admin console.
- Native apps from digital signage platforms enabling OTA updates.
Many tv dashboard software platforms provide native apps for following devices like BrightSign, Raspberry Pi 5, or Android-based signage boxes. This allows one-click pairing and content scheduling without manual browser configuration.
When to choose dedicated players:
- You want to display content on 10+ screens across multiple rooms.
- Different offices or multiple locations need centralized management.
- Minimal on-site IT intervention is preferred.
- 24/7 operation with 99.9% uptime is required.
For installation, consider tidy cable management using VESA mounts (400x400mm standard) and HDMI extenders to run cables behind walls. TVs mounted in professional office environments benefit from invisible wiring that doesn’t detract from office aesthetics, especially when paired with real-time digital signage setups that are easy to get started with.
Selecting Office TV Dashboard Software
Software falls into two layers: the data/dashboard layer (BI or analytics tools) and the display/management layer (TV/dashboard signage software that orchestrates what appears on screens). Understanding this distinction helps you avoid the fragility of ad-hoc browser-tab approaches.
The Fragility of Browser-Based Approaches
Simply opening dashboards in a browser tab and using a tab rotator plugin quickly becomes fragile when more screens and stakeholders get involved. Browser updates disable approximately 20% of extensions annually, creating maintenance headaches when your “cheap solution” suddenly stops working.
Combining BI Tools and Display Controllers
Modern office setups often combine tools like Power BI, Looker, or Databox for data visualization with a dedicated TV display controller that handles loops, playlists, and screen groups. The BI tool creates the visualizations; the display layer manages where and when they appear, unlocking additional benefits of real-time digital signage for your business such as automated, always-current content.
Must-Have Features for Offices
- Secure access to password-protected dashboards without exposing credentials on player devices.
- Playlist creation with customizable rotation intervals.
- Scheduling by time of day or day of week.
- Ability to manage all screens centrally from a single admin interface.
- Role-based access so different teams can manage their own content.
Example Workflow
- Build your KPI dashboard in your BI tool (Power BI, Looker, Databox).
- Publish a secure viewer URL with appropriate access controls.
- Add the dashboard url to your TV display software’s playlist.
- Assign the playlist to specific screens (e.g., “Sales Floor – London”).
- Set rotation intervals and schedules.
Browser-Based Rotators And DIY Scripts
The simplest approach to rotating dashboards involves keeping a computer connected to the TV with a browser-based tab rotator extension that cycles through URLs every 30-60 seconds. Tools like Tab Rotator or Crouton extensions handle the switching automatically.
This approach can work for:
- A single TV in a small office.
- Quick experiments before committing to dedicated software.
- Environments where someone can restart things manually when they break.
Typical problems with DIY rotators:
- Extensions get disabled by browser updates (Chrome stats suggest 20% annual breakage).
- Machines reboot overnight and don’t re-open the browser automatically.
- Dashboards freeze or crash after running for long periods.
- Session timeouts log users out, leaving error screens on display.
- No centralized management when URLs change or new dashboards need adding.
If you choose this approach, configure auto-login, auto-launch of the browser on startup, and consider a watchdog script (PowerShell on Windows, Bash on Linux/macOS) that monitors the browser process and restarts it if crashed. Most dashboard tools that run in browsers will work, but reliability requires extra scripting effort.
Position this as a short-term solution or suitable for experimentation before adopting dedicated dashboard software.
Dedicated TV Dashboard & Digital Signage Platforms
Dedicated platforms allow non-technical staff to publish dashboards to specific screens or groups without touching the player devices directly. An admin simply selects content, assigns it to “Engineering – NYC” or “Sales Floor – London,” and the screens update within minutes.
Key advantages:
- Content scheduling by time of day (operational metrics during work hours, summary views overnight).
- Remote player monitoring with screenshots or heartbeat checks.
- Role-based access so marketing owns marketing screens, sales owns sales screens.
- Built-in failover to static images if live dashboards fail to load.
These digital signage solution platforms support multiple content types beyond live dashboards:
- Static announcement slides.
- Video loops for company updates.
- News tickers with RSS feeds.
- Emergency messages that interrupt normal rotation.
- Web pages from internal systems.
Importantly, these tools handle SSO, two-factor authentication, and secure access to BI tools without exposing credentials on the TV itself. Some platforms use server-side rendering—logging into your BI tool on a secure server, capturing the dashboard as an image, and sending only the rendered image to TVs.
Organizations typically standardize on one such platform across all offices to simplify training and governance. Popular options include ScreenCloud, Rise Vision, Yodeck, Fugo, and similar digital signage platforms that integrate with major BI tools.
Security And Compliance For Office TV Dashboards
Office TV dashboards often show confidential metrics—revenue figures, customer data, incident counts—so security can’t be an afterthought. What’s convenient for internal visibility could become a liability if handled carelessly.
Main Risks to Address
- Credentials saved on devices behind TVs that could be accessed by unauthorized personnel.
- Dashboards visible to visitors in reception areas or through glass walls.
- Potential exposure of customer-identifiable information on screens in public areas.
- Session hijacking if player devices are compromised.
Mitigation Strategies
- Use service accounts or restricted BI views that only surface aggregated data appropriate for public office display.
- Integrate with corporate SSO (SAML, OpenID Connect) so dashboard access aligns with existing identity controls.
- Avoid showing individual customer names or other PII on dashboards in open areas.
- Place screens showing sensitive data in badge-restricted areas rather than reception.
For regulated sectors—finance, healthcare, public sector—IT and compliance teams should review what can be shown and where screens are placed before deployment.
Safe Authentication And Credential Handling
Avoid typing admin credentials directly on wall-mounted devices, and don’t store full-privilege accounts in browser password managers on players. These practices create unnecessary risk.
Best practices for credential handling:
- Use read-only or viewer-only accounts for BI tools (e.g., “tv-viewer@company.com” with view-only permissions).
- Consider “rendered images” or snapshot-based display where a cloud service logs in, renders dashboards server-side, and sends images to TVs rather than live data connections.
- Encrypt data in transit (HTTPS mandatory) and at rest on any intermediate servers.
- Rotate credentials regularly and revoke access when employees leave teams that own certain dashboards.
The snapshot approach is particularly valuable for sensitive data: the TV never actually connects to your BI tool directly. Instead, a secure server renders the dashboard every few minutes and pushes a static image. Even if the player is compromised, no live access credentials are exposed.
On-Premise And Self-Hosted Dashboards
Some organizations run self-hosted tools like on-premise Grafana, custom internal dashboards, or legacy reporting tools only reachable on the internal network. These require different considerations.
Configuration for on-premise dashboards:
- Players join the corporate domain and connect via Ethernet or secured Wi-Fi.
- No data leaves the corporate network if regulations prohibit cloud relay services.
- Dashboard screens are placed in badge-restricted areas rather than public corridors.
- IT documents which screens can show which internal systems.
In 2025, many firms use hybrid approaches: some dashboards from cloud tools like Power BI or Google Analytics, others from on-prem sources like internal Grafana or custom apps. A single TV display management layer coordinates both, applying appropriate security controls to each content source.
For government networks or internal banking systems where data cannot touch external services, ensure your chosen signage platform supports fully on-premise deployment or air-gapped operation.
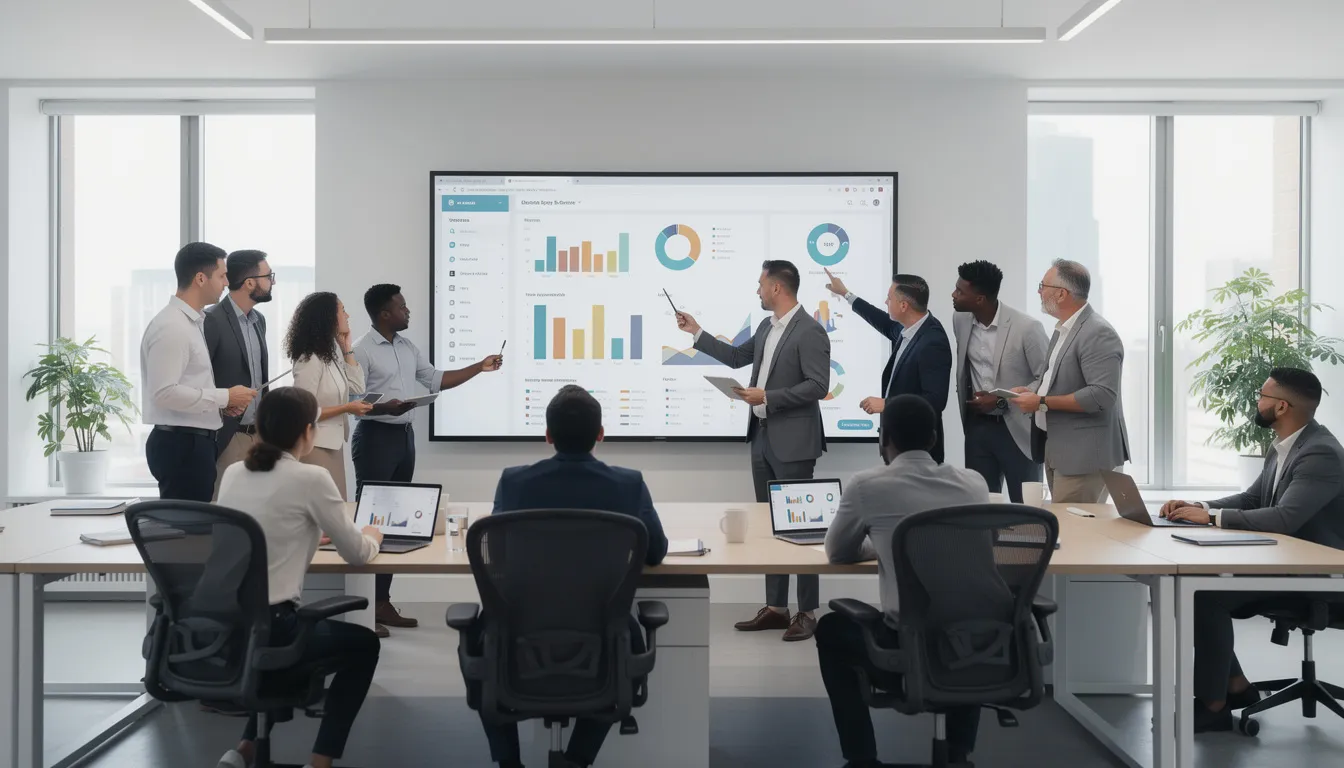
Designing Effective Office TV Dashboards
Well-designed TV dashboards allow someone walking by to understand the key status within a few seconds, even from several meters away. The goal isn’t comprehensive analysis—it’s immediate visibility into what matters right now.
Design Principles for TV Dashboards
- Limit to 5-10 KPIs per dashboard view, rotating additional detail into subsequent slides.
- Use large typography: 40-80px headlines for 55-65” screens viewed from 3-5 meters.
- Employ strong color contrast so information remains readable across the room.
- Reserve attention-grabbing colors (red, orange) for critical states like SLA breaches.
- Use simple icons rather than dense tables or complex charts.
Quick design checklist:
|
Element |
Recommendation |
|---|---|
|
Headline font size |
40-80px |
|
Body/number font size |
24-40px |
|
Widgets per view |
5-10 maximum |
|
Color palette |
3-5 colors total |
|
Refresh interval |
30-90 seconds per view |
|
Animation |
Minimal or none |
Critical states—incidents, SLA breaches, major revenue dips—should be visually distinct without requiring close reading. A red background on a “Current Incident” tile communicates urgency instantly.
TV Vs Desktop Dashboard Layout
Desktop dashboards assume close viewing (50-70cm) and interactivity—users click, filter, drill down, and explore data. TV dashboards are passive, distance-viewed, and often seen in peripheral vision while people work.
|
Desktop Dashboard |
TV Dashboard |
|---|---|
|
Detailed filters and controls |
No interactive elements |
|
Dense tables with 50+ rows |
Maximum 5-10 data points |
|
Complex legends and footnotes |
Self-explanatory labels |
|
Small, information-dense fonts |
Large, scannable headlines |
|
Multi-page drill-downs |
Everything visible at once |
Create TV-specific versions of key dashboards rather than reusing the exact same layout built for analysts at their desks. Most BI tools allow you to build multiple dashboards from same or similar data sources—one optimized for desktop analysis, another optimized for wall display.
Use tiles or cards per KPI with clear headlines like “Monthly Recurring Revenue: $2.1M” or “Open Support Tickets > 24h: 12.” Test visibility by standing 3-5 meters away from a TV in a real office space before deploying the design company-wide.
Choosing Metrics That Belong On The Wall
Not every metric belongs on a public TV display. Prioritize leading indicators and shared goals rather than raw, sensitive, or personally identifiable data.
Examples by department:
|
Department |
Good Wall Metrics |
Avoid |
|---|---|---|
|
Sales |
Pipeline value, deals closed, calls made |
Individual rep underperformance |
|
Marketing |
Leads generated, CPA, campaign ROAS |
Customer email addresses |
|
Support |
First response time, CSAT, ticket volume |
Individual customer names |
|
Operations |
On-time shipments, order processing time |
Employee performance rankings |
|
Engineering |
Uptime %, deployment frequency, incident status |
Security vulnerability details |
Include “north star” metrics that reinforce company priorities for the current quarter—Q2 2025 revenue targets, NPS objectives, or key product adoption goals. These keep everyone focused on what leadership has identified as most important metrics.
Avoid showing individual underperformance in ways that shame people. Focus on team-level metrics or anonymized leaderboard views that encourage improvement rather than public embarrassment.
Revisit your metric list at least quarterly to align with changing strategic initiatives and remove outdated widgets that no longer drive behavior.
Office TV Dashboard Use Cases By Team
Different departments benefit from different combinations of dashboards. Offices often dedicate specific screens to each team, with cross-functional dashboards in shared spaces like kitchens or reception showing company-wide health.
The following use cases provide concrete examples with data sources commonly used in 2025. Each scenario can be adapted to your specific tools and organizational structure.
Sales And Revenue Teams
Sales TV dashboards typically show daily pipeline value, deals by stage, bookings by rep, and progress toward monthly or quarterly quota. The goal is keeping targets top of mind and celebrating wins in real time.
Common sales dashboard elements:
- Current quarter bookings vs target with color-coded progress bars.
- Pipeline by stage (prospect, SQL, opportunity, closed-won).
- Today’s activities: calls made, meetings booked.
- Recent wins with deal value (anonymized if sensitive).
- Rep leaderboard showing quota attainment percentages.
Many offices place these screens near SDR and AE pods where they’re visible throughout the day. Case studies suggest approximately 18% improvement in quota attainment when teams have constant visibility into their progress.
Data sources: Salesforce, HubSpot CRM, Pipedrive, or similar CRMs, typically refreshing every 5-15 minutes.
Highlight leading indicators (calls, meetings) alongside outcomes. This helps managers spot issues early in the month—if activity is down, outcomes will follow—rather than waiting until quota deadlines to react.
Marketing And Growth Teams
Marketing dashboards focus on metrics that show campaign performance and funnel health: website sessions, conversion rates, cost per acquisition, campaign ROAS, and lead volume by channel.
Typical marketing dashboard layout:
- Top row: This week vs previous periods performance (sessions, leads, conversions).
- Middle row: Active campaigns with spend and CPA.
- Bottom row: Channel breakdown (organic, paid social, paid search, email).
Example scenario: During a product launch week, marketing monitors a TV dashboard showing real-time signups, landing page conversion rates, and ad spend efficiency. When CPA spikes on one channel, the team notices immediately and reallocates ad budget to better-performing channels.
Data sources: Google Analytics 4, Meta Ads, Google Ads, marketing automation platforms like HubSpot or Marketo.
Consider placing at least one shared “funnel” dashboard visible to both marketing and sales areas. This alignment helps both teams see how marketing leads flow into sales pipeline and where handoff improvements might help.
Customer Support And Success
Support dashboards commonly show live ticket volume, open cases by priority, first response time, and customer satisfaction score (CSAT or NPS). These metrics make data accessible to the entire support team without requiring constant Zendesk refreshes.
Configuration example:
- Primary view: Current queue overview with ticket counts by priority and SLA status.
- Secondary view: Real-time SLA breach alerts showing tickets approaching deadline.
- Tertiary view: CSAT trends and recent customer feedback highlights.
Customer success teams might add: renewals due this month, expansion opportunities, and health scores for key accounts.
Data sources: Zendesk, Intercom, Freshdesk, Gainsight, or similar platforms, updating at least every few minutes.
If your support dashboard shows detailed ticket information, consider anonymization practices so customer names aren’t visible in shared spaces. Aggregate metrics like “47 open tickets, 3 approaching SLA” communicate status without exposing specific customers.
Product, Engineering, And Operations
Product and engineering teams typically display: deployment frequency, error rates, incident status, uptime percentages, and core product usage metrics. Operational teams focus on logistics and fulfillment data.
Engineering “status wall” example:
- Incident status indicator (green/yellow/red).
- Current uptime (99.96% this month).
- Today’s deployments completed.
- On-call engineer name and contact.
- Jira sprint burndown.
Operations dashboard example (transportation fleet or warehouse):
- On-time shipment percentage.
- Orders in processing.
- Inventory levels for key SKUs.
- Fleet utilization or vehicle status.
Data sources: Datadog, New Relic, Grafana, Jira, Monday.com, or custom internal tools exposed via APIs.
For operational teams, low latency matters more than other departments. Consider 1-2 minute refresh intervals for time-sensitive metrics versus 15-30 minutes for slower data. Alert visibility should be prominent—a red banner for active incidents rather than a small icon, mirroring guidance on implementing real-time information on your digital displays so status changes are impossible to miss.
Leadership, HR, And Company-Wide Views
Executive and HR dashboards show high-level health indicators: revenue vs plan, headcount, retention rates, diversity metrics, and key strategic project milestones.
Placement considerations:
- Boardrooms or leadership areas for sensitive financial details.
- Badge-restricted executive floors for detailed performance data.
- Common areas (kitchens, lobbies) for appropriate company-wide summaries.
“Company pulse” dashboard for common areas:
- Revenue progress toward annual target.
- Product adoption metrics (users, engagement).
- Recent wins and milestones.
- Upcoming company events (town halls, social events).
- New hire welcomes with photos.
Consider mixing in non-numeric content: photos from recent team events, new-hire welcome slides, policy reminders, or free trial promotion for internal products. This keeps the loop engaging rather than just number-heavy.
Leadership dashboards should update at least daily, but not necessarily every few minutes—the underlying data (headcount, monthly revenue) typically changes less frequently.
How To Set Up An Office TV Dashboard (Step-By-Step)
This section walks through a realistic end-to-end setup: from choosing a screen to having live KPIs displayed on a wall within a day. The process isn’t time consuming once you’ve made key decisions.
High-Level Steps
- Plan your metrics and audiences.
- Pick and prepare hardware.
- Connect dashboards securely.
- Create playlists and schedules.
- Test, launch, and iterate.
Start with a pilot: 1-2 TVs in a main office area. Expand once the process is smooth and stakeholders see the value. A single screen setup typically takes 2-4 hours; full multi-screen deploys average 1-2 days per screen including planning and testing.
Involve both IT (for devices and security) and team leaders (for KPI selection) early in the process. This prevents last-minute security objections and ensures the metrics displayed actually matter to people.
1. Decide What You Want To Display
Before any hardware purchase, teams should list the 5-10 metrics that matter most in the next 3-6 months and who needs to see them. This planning prevents ad-hoc requests from derailing your setup later.
Planning steps:
- Group metrics into logical dashboards (e.g., “Sales Performance,” “Marketing Acquisition,” “Support Health”).
- Map each dashboard to a physical location (sales dashboard in the sales pod, company dashboard in the kitchen).
- Confirm which metrics can be visible to all employees versus requiring restricted access areas.
- Document everything in a one-page plan to align stakeholders.
Questions to answer:
|
Question |
Example Answer |
|---|---|
|
What metrics drive behavior this quarter? |
Pipeline velocity, NPS, uptime |
|
Who needs to see each metric? |
Sales team, whole company, engineering |
|
Where will people naturally see the screens? |
Near their desks, common areas |
|
What data is too sensitive for public display? |
Individual performance, customer names |
This documentation becomes your reference when adding more screens or changing metrics each quarter.
2. Prepare Screens And Player Devices
Install the TV in the chosen location with a wall mount, connecting it via HDMI to your chosen player device (mini PC, signage device, etc.).
Setup steps:
- Mount the TV at appropriate viewing height (approximately 1.6m to center for standing viewing).
- Connect the player device via HDMI and power.
- Configure the TV to stay on during office hours (disable aggressive energy-saving modes).
- Connect the player to the network (Ethernet preferred for reliability).
- Verify the player can access required dashboard URLs and internal resources.
Critical configuration:
- Enable HDMI-CEC if available so the player can wake the TV on boot.
- Set the TV to power on when signal is detected.
- Configure the player for auto-login and auto-launch of the dashboard app or browser.
Label each player physically and in your management console with its location (e.g., “HQ-3F-Sales-TV1”). This simplifies troubleshooting when you have multiple screens and can’t immediately identify which device is having problems.
3. Connect Your Dashboards Securely
Configure access from the player or TV signage software to each dashboard URL, using SSO or secure tokens as required by your BI tools.
Security best practices:
- Create a dedicated viewer account (e.g., “tv-dashboard@company.com”) with read-only roles.
- Avoid using personal accounts that have edit or admin permissions.
- Test that dashboards load correctly with fonts and charts scaling appropriately to 1080p or 4K.
- Verify the dashboard fits properly in full screen without scroll bars.
Refresh interval guidance:
|
Data Type |
Recommended Refresh |
|---|---|
|
Real-time operations |
1-5 minutes |
|
Sales pipeline |
5-15 minutes |
|
Marketing campaigns |
15-30 minutes |
|
Financial metrics |
30-60 minutes |
Test credential expiry behavior: confirm dashboards still display correctly after session timeouts or token refreshes. Some BI tools require token rotation every 15-60 minutes—your signage software should handle this automatically.
4. Create Playlists And Schedules
Group dashboards into playlists per screen with appropriate rotation intervals.
Example playlist for a sales area:
- Sales pipeline overview (30 seconds)
- Rep activity leaderboard (30 seconds)
- Weekly deals closed (30 seconds)
- Company announcements (15 seconds)
- Loop back to start
Scheduling options:
- Show operational metrics during working hours (8am-6pm).
- Display summary views evenings and weekends.
- Feature different content for specific days (Monday morning: weekly targets; Friday: wins celebration).
Keep rotation intervals long enough (30-90 seconds) for viewers to read and interpret each slide without feeling rushed. Add non-dashboard content—announcements, event reminders, or welcome messages—between metrics to keep the loop engaging.
Document your initial playlist configuration so it can be replicated as more screens are added to other dashboards or other offices.
5. Test, Launch, And Iterate
Run the dashboards for a few days in a pilot area and gather feedback from employees.
Launch process:
- Deploy to pilot screens.
- Observe for 2-3 days: Do people stop to look? Do they reference the screens in meetings?
- Gather feedback: Is the information useful? Are fonts readable?
- Adjust metric selection, fonts, or rotation intervals based on input.
- Remove widgets that never get referenced.
Set a regular review cadence—monthly works well—to keep TV dashboards aligned with current goals and campaigns. What mattered last quarter may not matter this quarter.
Success indicators to track:
- Are key questions in stand-ups answered by what’s visible on the TV?
- Has the frequency of “where is that report?” questions decreased?
- Do teams reference specific dashboard data in conversations?
- Are issues being detected faster through wall visibility?
Capture before/after examples or anecdotes (faster incident detection, improved quota attainment) to justify scaling the initiative to more screens.
Scaling And Managing Multiple Office TV Dashboards
Managing one dashboard screen is simple. Managing dozens across floors, offices, or countries requires more structure. Without standardization, you’ll spend all your time on maintenance rather than value delivery.
Scaling Recommendations
- Standardize on a single hardware type (e.g., all Intel NUC or all Raspberry Pi 5) for simplified support and spare parts.
- Use one dashboard display platform across all offices to reduce training burden.
- Group screens logically (by office, floor, department) for bulk content changes.
- Assign ownership: sales operations manages sales TVs, marketing ops manages marketing TVs.
Set up monitoring, alerts, and simple SLAs (e.g., “dashboard outage resolved within 1 business day”) to keep screens consistently reliable. Nothing undermines dashboard credibility faster than a screen that shows an error page for days because nobody noticed.
Remote Management And Monitoring
Remote control becomes essential once screens are in different rooms, buildings, or cities. You don’t want to walk to each TV with a bluetooth keyboard every time something needs changing.
Essential remote capabilities:
- Remote screenshots to see what’s actually displaying.
- Reboot commands for stuck devices.
- App restarts without full device reboot.
- Software update control across all players simultaneously.
- Content playlist changes without physical access.
Integrate TV dashboard management into existing IT remote monitoring tools when possible. Many organizations add their signage players to the same RMM (Remote Monitoring and Management) system used for laptops and servers.
Implement alerts when a player goes offline, is stuck on an error page, or hasn’t updated content for a set period. Proactive monitoring catches problems before employees start complaining about stale or broken displays.
Schedule regular maintenance windows to keep firmware, operating systems, and signage applications up to date. Players left unpatched for months become security risks and compatibility problems.
Multi-Screen Walls And High-Impact Displays
“Screen walls” or grid displays (2×2 or 3×3 configurations) are used by NOCs, trading teams, or IT operations to view more than one dashboard simultaneously without rotation delays.
Technical considerations:
- One machine with multiple video outputs, or dedicated video wall controllers.
- Higher-spec hardware to drive multiple 4K displays simultaneously.
- Careful attention to latency—viewers notice when screens update at different times.
Content strategies for walls:
- Group related dashboards spatially (left column: marketing, middle: sales, right: support).
- Use one dashboard as the “hero” view with supporting context on surrounding screens.
- Reserve one screen for alert-only display that’s normally green.
Performance matters more with walls—multiple heavy dashboards running concurrently strain low-spec devices. Test thoroughly under realistic load before committing to production.
For mission-critical walls, establish failover plans. A backup device should be ready to take over quickly if the main player fails. The cost of a spare is minimal compared to a NOC wall going dark during an incident.
FAQ
This FAQ addresses common practical questions that arise when teams start planning or rolling out office TV dashboards. Answers focus on concrete guidance rather than abstract theory.
How much does it typically cost to set up an office TV dashboard?
Costs vary based on existing equipment and scale. For a new deployment, expect $600-$1,200 per screen including a 55” 4K TV (~$450), small player device (~$250), VESA mount and cabling (~$100). Commercial-grade displays for 24/7 operation cost $1,000-$3,000 each.
Software ranges from free tiers of BI tools up to $5-20 per screen per month for dedicated signage platforms. Many organizations repurpose existing TVs and PCs to reduce initial spend—a computer monitor you already own can work for small-scale pilots.
Budget not just for hardware and software, but also for IT and operations time to plan, install, and maintain the deployment. A full setup taking 1-2 days per screen means labor costs often exceed hardware costs for larger deployments.
How often should office TV dashboards update their data?
The ideal refresh interval depends on data type and source system capabilities. Highly dynamic operational metrics (support queue, incident status) might update every 1-5 minutes. Strategic or financial KPIs might only need hourly or daily refreshes.
Extremely aggressive refresh rates can overload APIs—Salesforce, for example, limits to approximately 100 API calls per minute—and may not add value if underlying data only changes a few times per hour. Align refresh schedules with the update cadence of source systems to avoid unnecessary polling, especially when you’re surfacing real-time stock prices and other live metrics on digital signage.
For most teams, 5-15 minute refresh intervals balance freshness against API load and system performance.
Where should we place TV dashboards in an open office?
Place screens where relevant teams can see them without turning away from their workstations significantly—at the front of a sales pod, near a central walkway, or on the wall facing a team’s desks. Screens should be visible with peripheral vision during normal work.
Avoid locations where confidential data could be easily viewed by visitors or photographed from public areas. Reception or glass-walled conference rooms aren’t appropriate for sensitive metrics. Consider glare, ambient light, and noise levels so screens are both visible and not distracting.
Standard mounting positions screens at approximately 1.6m to center height for comfortable viewing while standing. Adjust based on typical viewing distances and whether people will primarily be seated or walking by.
How do we prevent office TV dashboards from becoming “background noise”?
Dashboards become noise when they’re cluttered, rarely referenced, or not aligned with active goals. The cure is curation: show only current, meaningful metrics that drive behavior this quarter.
Update content regularly to reflect new campaigns, quarters, or projects. Encourage managers to reference the screens during stand-ups and meetings—this signals that the information matters and reinforces the habit of checking the wall.
Limit rotation loops to 3-8 slides so important views appear frequently enough. If you have 20 dashboards rotating, each one appears so rarely that people stop paying attention.
Can we use office TV dashboards for remote or hybrid teams as well?
While physical TVs benefit in-office staff, the same dashboards can usually be shared through web links, intranet embeds, or meeting screen shares for remote workers. The dashboard url you display on the office wall can be bookmarked by remote team members or embedded in Confluence pages.
Many organizations mirror key “office wall” dashboards into virtual spaces like Slack channels (using automated screenshot posts) or recurring video stand-ups. This ensures everyone sees the same metrics regardless of location.
Some organizations install smaller screens in home offices for leaders or on-call engineers who need constant visibility into critical metrics. This depends on budget, work-from-home policies, and how essential real-time visibility is for specific roles.
Customization And Templates For Office TV Dashboards
Customization is at the heart of an effective office tv dashboard strategy. Every organization has unique goals, workflows, and key performance indicators, so a one-size-fits-all approach rarely delivers maximum impact. Modern tv dashboard software makes it easy to create dashboards that reflect your team’s priorities, whether you want to display multiple dashboards on a single screen or tailor each dashboard to a specific department.
Most dashboard software platforms offer a library of templates designed for common business needs—think sales performance, customer satisfaction score, or marketing campaign metrics. These templates provide a fast starting point, allowing you to display important data with just a few clicks. For teams with more specialized requirements, dashboard tools like Power BI or Google Data Studio enable you to build custom dashboards from scratch, pulling in data from your preferred sources and arranging key metrics in a layout that works for your office tv display.
Customization doesn’t stop at data selection. With most tv dashboard software, you can add your company’s branding, adjust color schemes, and modify layouts to ensure your dashboards are both visually appealing and easy to read from across the room. You can also set up your dashboard to display multiple dashboards in rotation, ensuring that every team gets visibility into the metrics that matter most to them.
By leveraging templates and customization features, organizations can ensure their office tv dashboards are not just informative, but also engaging and aligned with company culture. The result: a dashboard display that keeps everyone focused on performance, with important data always accessible at a glance.
Integration And Compatibility With Office Systems
Seamless integration is essential for any tv dashboard to deliver real value. The best tv dashboard software is designed to connect effortlessly with the systems your teams already use—whether that’s Microsoft Office, Google Workspace, Salesforce, or a range of other business platforms. This means you can pull live data directly from your existing tools and display it on your office tv without manual exports or complicated workarounds.
Compatibility is another key consideration. Leading dashboard software solutions support a wide variety of devices, from smart TVs and computer monitors to tablets and mobile phones. This flexibility ensures that your dashboards are always accessible, whether you want to display them on a large screen in the office, stream content to remote locations, or access key metrics on the go.
By integrating your tv dashboard with your core office systems, you streamline data management and ensure that everyone is working from the same, up-to-date information. With just a dashboard url and a few configuration steps, you can connect your data sources, set up automated updates, and keep your team informed—no matter where they are or what device they’re using.
Measuring Success And ROI Of Office TV Dashboards
To ensure your office tv dashboard investment is delivering real business value, it’s important to measure both usage and impact. Start by tracking key metrics such as employee engagement with the dashboards, improvements in team productivity, and changes in customer satisfaction scores. Many organizations also monitor how quickly teams respond to issues or opportunities now that important data is visible on the tv display.
Advanced dashboard software often includes analytics features that let you see which dashboards are viewed most frequently, how often data is accessed, and which metrics drive the most action. Pair these insights with regular employee feedback—through surveys or informal check-ins—to understand how the dashboards are influencing day-to-day performance.
Ultimately, the ROI of your office tv dashboards comes down to whether they help your teams make better decisions, respond faster, and stay aligned on key goals. By continuously measuring performance and refining your dashboard content, you can maximize the impact of your tv dashboard setup and ensure it remains a valuable asset for your organization.
Troubleshooting And Support For Office TV Dashboards
Reliable support is crucial for keeping your office tv dashboards running smoothly. Most leading tv dashboard software providers offer dedicated support teams, comprehensive documentation, and online communities where users can find answers and share best practices. Whether you need help connecting a new dashboard, troubleshooting a display issue, or configuring your software, expert assistance is usually just a click or call away.
In addition to vendor support, many organizations establish their own internal processes for managing dashboard software and tv displays. This might include assigning responsibility for regular maintenance, setting up monitoring alerts, and documenting troubleshooting steps for common issues. By combining external resources with internal know-how, you can minimize downtime and ensure your dashboards are always available when your team needs them.
Effective troubleshooting and support not only keep your dashboards online—they also help you adapt quickly as your data needs evolve, ensuring your office tv remains a reliable source of performance insights.
Future Developments And Trends In Office TV Dashboards
The landscape of office tv dashboards is evolving rapidly, with new technologies and trends shaping the future of how organizations display and interact with data. Artificial intelligence (AI) and machine learning (ML) are beginning to play a larger role, enabling smarter dashboards that can surface trends, predict outcomes, and even suggest actions based on real-time data.
Cloud-based tv dashboard solutions are also on the rise, offering greater flexibility, scalability, and cost savings compared to traditional on-premise setups. As more organizations prioritize security and compliance, expect to see enhanced data protection features built into dashboard software, ensuring sensitive information remains secure on every tv display.
Looking ahead, emerging technologies like augmented reality (AR) and virtual reality (VR) could transform the way teams interact with dashboards, making data even more immersive and accessible. Natural language processing (NLP) may soon enable voice-controlled dashboards, allowing users to access key metrics or switch between dashboards with simple spoken commands.
As these innovations continue to develop, office tv dashboards will become even more powerful tools for driving data-driven decision-making and business growth—ensuring that the right data is always on display, wherever your teams need it most.