Public transportation systems—buses, trams, metros, light rail, commuter rail, and ferries—move billions of passengers annually across cities worldwide. Public transportation refers to shared passenger transport services available for use by the general public, typically running on established routes and fixed schedules for a set fare. Public transportation is usually funded by a mix of passenger fares, government subsidies, and tax revenue. Public transportation systems are designed to transport multiple people simultaneously, providing an alternative to private vehicle use to reduce traffic congestion and environmental impact. Public transportation provides a greener alternative to personal vehicles by reducing energy consumption and lowering carbon emissions. Using public transit is generally recognized as a more sustainable and economical choice for urban commuters.
This article is intended for government agencies, public service organizations, and transit professionals seeking to improve passenger communication and operational efficiency. Effective real-time communication is essential for reliable, accessible, and sustainable public transportation systems. In 2026, delivering up-to-date passenger information has become mission-critical as riders expect reliable, instant updates amid climate disruptions and service changes. This article explores how government and public service organizations can deploy real-time, on-premises digital signage to transform transit communication, and why SignageTube Live combined with PowerPoint animations offers a practical toolset for agencies needing rapid, centralized screen updates in a widely adopted environment.
Introduction to Public Transportation and Real-Time Information
Real-time information in public transit means dynamically updated data feeds delivering live vehicle arrivals, departure times, service disruptions, platform changes, and occupancy levels. Standards like GTFS-Realtime enable automatic synchronization across apps, websites, and displays, reducing perceived wait times and passenger anxiety. Studies show delays in communication can reduce overall system usage by up to 20%.
For transit agencies, this creates demand for solutions that can push real time content to hundreds of screens simultaneously. SignageTube Live addresses this by providing on-prem infrastructure that integrates with existing data sources while allowing communications teams to manage content through familiar tools. By streamlining content deployment and centralizing control, SignageTube Live significantly improves operational efficiency for transit agencies, helping them optimize digital signage operations and deliver timely information to passengers.
The Role of Public Transportation in Modern Cities
Buses, subways, trams, and commuter rail services support daily commuting, tourism, and access to hospitals, schools, and government buildings. In dense metros, 70-80% of daily commutes rely on these systems.
Consider New York City’s subway, handling over 1.7 billion rides yearly across 472 stations, or London Underground serving 1.4 billion passengers at 272 stations. Mid-sized cities like Long Beach, California illustrate practical implementation with bus rapid transit and light rail serving 10-15 million annual trips.
Common passenger pain points persist across these systems. Missed connections affect 25-30% of trips according to rider surveys. Unclear service alerts frustrate multilingual populations—40% of NYC riders speak languages other than English. Static signage becomes outdated within hours of disruptions. These challenges make visual communication on station and vehicle screens as critical as the infrastructure itself for perceived service quality.
Market Trends and Public Transportation
Public transportation is undergoing a significant transformation as agencies respond to shifting market trends and the evolving needs of urban populations. Rail services, including commuter rail and light rail, are at the forefront of this evolution, offering efficient and sustainable mobility options.
Data Analytics in Transit
Data analytics has become a cornerstone for transit agencies seeking to understand user behavior and adapt their business strategy accordingly. By collecting data from ticketing systems, mobile apps, and onboard sensors, agencies gain valuable insights into passenger flows, peak travel times, and service demand.
A chief data officer often leads these data initiatives, ensuring that raw data is processed into actionable intelligence that informs route planning, schedule adjustments, and service enhancements. This data-driven approach enables organizations to optimize operations, improve customer satisfaction, and respond proactively to changing commuter patterns.
Digital Signage Integration
Many businesses are also leveraging digital signage to deliver real-time content and targeted advertising, increasing customer engagement and generating new revenue streams. As digital signage systems become more integrated with transit data, agencies can provide timely updates and relevant information, further enhancing the passenger experience and supporting the overall business objectives of public transportation providers.
Revenue Generation
Digital signage not only improves communication but also opens up new avenues for revenue generation through advertising and partnerships. By displaying targeted ads and sponsored content, transit agencies can offset operational costs and reinvest in service improvements.
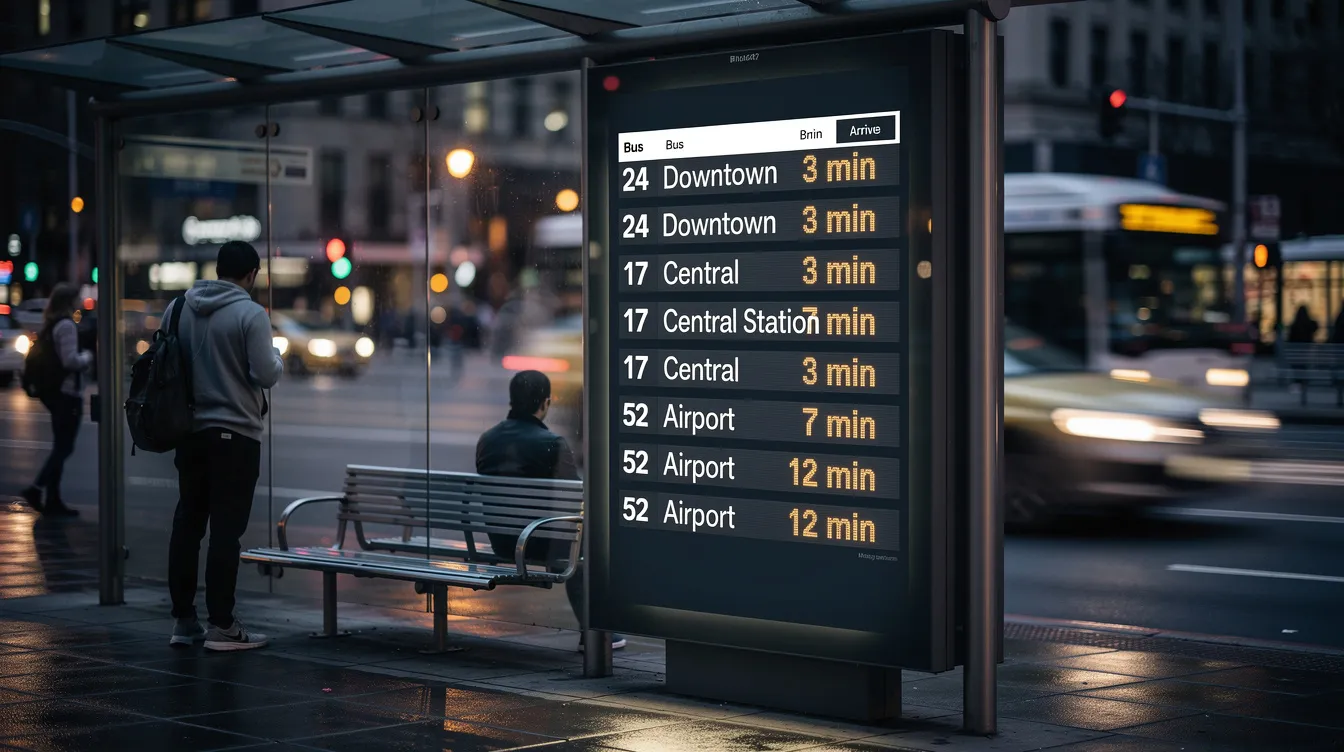
Real-Time Digital Signage in Public Transportation
Digital signage in transit contexts includes platform-mounted LCDs for departure boards, large-format video walls in concourses, weatherproof totems at bus stops, and onboard screens in vehicles.
Real-Time Data Integration
Unlike scheduled playlists that loop pre-recorded content, real-time digital signage pulls live data from GTFS-RT feeds, AVL systems, and incident management platforms, relying on robust data processing methods such as batch and stream processing to enable rapid updates and analytics for digital signage.
Typical content includes live departure boards with color-coded statuses, dynamic wayfinding with arrows and ETAs, disruption banners, weather forecasts, and safety PSAs. When a tram line experiences a signal failure, screens across 50 affected stops can display reroutes and delay timers within seconds, preventing platform overcrowding.
Modernization of Signage Networks
Many businesses and agencies still rely on printed posters or single-purpose LED tickers. Modern screen networks consolidate these into flexible digital layouts managed remotely, with the transportation digital signage market growing at 9.9% CAGR through 2030.
On-Premises vs. Cloud-Only Approaches
On-prem digital signage means content servers and controllers are hosted inside the agency’s own network or data center. This approach satisfies government IT policies mandating data sovereignty and enables sub-second update latency for critical alerts.
Cloud-only signage hosts everything in external providers’ data centers accessed via public internet. While this offers scalability, it exposes risks for transit operations. During storms, 20-30% of networks experience connectivity issues—exactly when passengers need information most. Compliance concerns with regulations like FISMA also push public entities toward local control.
Transit authorities favor on-prem for operational screens due to tighter uptime control (targeting 99.9%), integration with internal systems like dispatch, and the ability to operate within existing secure VLANs. SignageTube Live is designed as an on-prem solution that supports real time updates while using PowerPoint for content design—bridging enterprise security with familiar tools.

Key Use Cases for Real-Time Signage in Public Transit
Different locations in a transit network have distinct information needs. Stations require high-frequency updates every 30 seconds, vehicles sync periodically every 5-10 minutes, and operations centers need comprehensive dashboards. Each use case benefits from templates that inject live data automatically.
Stations, Hubs, and Terminals
Large rail hubs and bus terminals use departure boards showing arrivals, track assignments, and delays. During Monday peak at a major commuter rail station handling 750,000 daily passengers, screens display minute-by-minute status changes that help riders make better decisions about platform positioning.
When incidents occur, real-time signage automatically switches layouts to emphasize alerts, rerouting instructions, and crowd control messages. A track closure triggers red alert layouts replacing standard departure information across affected platforms.
Accessibility considerations require high-contrast text (4.5:1 ratio minimum), large fonts (24pt+), and multilingual overlays. Pilots implementing these standards reduced wrong-platform errors by 40%.
Onboard Buses, Trams, and Trains
In-vehicle screens provide next-stop indicators, transfer suggestions, and emergency messaging. On a 2025 city bus, passengers see live interchange options: “Bus 45 to Metro Line 2 in 3 min” as they approach a major stop.
Onboard systems sync with depot servers via WiFi or cellular, then cache content locally for areas with spotty coverage. This deployment method ensures reliable operation even when mobile connectivity drops.
PowerPoint-based templates let agencies standardize layouts across mixed fleets. Whether updating older buses or new trams, the same branded design appears consistently, supporting efficient content creation across vehicle types.
Intermodal Connections and Wayfinding
Digital signage helps passengers navigate between bus, train, metro, and ferry connections with directional arrows, walking times, and ETAs. At a park-and-ride facility, screens guide drivers to “Express Bus Downtown: Platform B, departing in 8 minutes.”
When real-time feeds detect delays that make a planned transfer unrealistic, screens can suggest alternatives. This adaptive routing, generated from GTFS data, cut missed connections by 25% in 2024 pilots.
Customer Engagement Strategies for Digital Signage
Maximizing customer engagement is essential for the success of digital signage in public transportation and other sectors. By leveraging data scientists and advanced digital signage content strategies, organizations can analyze user behavior to tailor content creation strategies that resonate with diverse audiences.
Analyzing User Behavior
Understanding when, where, and how passengers interact with digital displays allows for the deployment of relevant, real-time content that captures attention and drives action.
Interactive Features
Modern operating systems and cloud-based digital signage solutions support the efficient management and updating of digital signage networks, enabling organizations to deploy new campaigns or service alerts instantly across multiple locations. Interactive features, such as touchscreens or QR codes, further boost user engagement by encouraging direct interaction with the content.
Continuous Improvement
These strategies not only enhance the effectiveness of advertising but also improve the overall customer experience, making digital signage a powerful tool for organizations aiming to connect with users in meaningful ways. By continuously monitoring engagement metrics and refining content based on analytics, businesses can ensure their digital signage remains impactful and aligned with organizational goals.
Planning and Implementing Real-Time On-Prem Signage for Transit
Deploying a signage network for public transit requires multiple phases: assessment (4-8 weeks), pilot (2-4 months), rollout (6-18 months phased), and continuous optimization. Real-time signage solutions are typically implemented in stages, allowing organizations to deploy and adopt data-driven strategies effectively throughout each phase. This section outlines realistic work effort and timelines for government and public service organizations.
Scoping and Requirements
Key stakeholders include transit operations managers, IT and security teams, communications staff, accessibility officers, and unions. Requirements gathering covers screen counts, locations, supported languages, and data sources including GTFS feeds, AVL systems, and emergency alert platforms.
A modest scoping phase takes 4-8 weeks for small to mid-sized networks. Teams must define which screens are mission-critical (departure information) versus supplementary (tourism promotions).
Technical Architecture
The typical on-prem architecture includes a SignageTube Live server inside the agency network, media players at each location, and secure integrations with schedule feeds and incident management tools. Integration complexity varies with existing systems.
Simple pilots with 10-20 screens require 2-4 weeks of technical work. Full multi-modal networks demand several months. Close collaboration between IT security and signage providers ensures compliance with government audit requirements and proper storage of sensitive information.
Content Design and Governance
Content design often takes longest, involving brand guidelines and accessibility rules. PowerPoint-based templates let non-technical teams design and revise layouts without specialized graphics tools.
Standard template libraries include departure boards, disruption banners, safety campaigns, and government service messages. Initial template development takes 2-3 weeks with iterations. Ongoing updates require hours rather than days. Governance workflows define who can change templates and approval processes to maintain consistency.
Public Transit and Accessibility
Ensuring accessibility in public transit is a fundamental responsibility for agencies committed to serving all members of the community. Public transportation is often accessible, featuring accessibility features for seniors and people with disabilities. This includes features such as low-floor buses, audio and visual announcements, tactile paving, and priority seating. Para-transit services are flexible, often door-to-door, designed for individuals with disabilities or senior citizens. This involves more than just providing accessible vehicles and infrastructure—it requires a data-driven approach to identify gaps and optimize services for passengers with disabilities. By harnessing data analytics, agencies can gain insights into how different user groups interact with transit systems, pinpointing areas where additional support or improvements are needed.
Data initiatives led by chief data officers and data stewards help ensure that sensitive information is managed responsibly while driving continuous enhancements in accessibility. These efforts might include analyzing boarding patterns, monitoring the effectiveness of support services, and evaluating the accessibility of stations and vehicles. With robust analytics, agencies can make informed decisions that lead to more efficient, inclusive, and customer-focused transit systems. Ultimately, leveraging data and insights empowers public transit providers to deliver services that are not only compliant with regulations but also genuinely responsive to the needs of all customers.
Public Transportation and Safety
Safety remains a top priority for public transportation agencies, and data-driven strategies are playing an increasingly vital role in safeguarding passengers and staff. By systematically collecting and analyzing data on incidents, near-misses, and operational patterns, agencies can identify potential risks and implement targeted interventions to mitigate them. Digital signage is a key component of modern safety initiatives, providing real-time alerts, emergency instructions, and safety reminders directly to users throughout the transit network.
Many companies are integrating advanced technology, such as video surveillance and automated emergency response systems, to further enhance safety and support rapid decision-making. These systems work in tandem with digital signage to inform and guide users during routine operations and critical incidents alike. By leveraging real-time data and technology, public transit providers can create safer environments, improve response times, and ensure that both passengers and staff are well-informed and protected at all times.
Public Transportation and Sustainability
Sustainability is increasingly central to the mission of public transportation agencies, as they seek to reduce environmental impact and promote greener travel options. Data analytics enables agencies to optimize routes, schedules, and vehicle deployment, minimizing energy consumption and emissions across bus and train networks. By analyzing operational data, organizations can identify inefficiencies and implement solutions that make systems more efficient and environmentally responsible.
Many businesses and organizations are embracing sustainability as a core value, recognizing the long-term benefits for both the planet and their bottom line. Digital signage supports these efforts by delivering targeted information and awareness campaigns that encourage users to adopt eco-friendly behaviors, such as choosing public transit over private vehicles or participating in green initiatives. Efficient operating systems and data-driven insights empower agencies to manage resources responsibly, reduce waste, and continuously improve their sustainability performance. As a result, public transportation not only becomes a more attractive option for users but also contributes meaningfully to broader environmental goals.
Workload, Timelines, and Resource Requirements
Typical projects require one project manager, one IT specialist (part-time), one content lead, and occasional vendor support. A focused pilot in one bus depot and two stations takes 6-10 weeks. Full network rollouts phase across 6-18 months for larger cities.
Project Phases and Durations:
- Pilot: 6-10 weeks (10-50 screens, single corridor)
- Phase 1 Rollout: 3-6 months (Major stations, key routes)
- Full Network: 12-18 months (All platforms, vehicles, hubs)
Ongoing workload includes 5-10 hours weekly for routine updates, quarterly template refreshes, and annual maintenance. PowerPoint combined with SignageTube Live reduces training time by reusing existing office skills, cutting design effort by 50% compared to specialized tools.
Alternatives and Their Disadvantages Compared to On-Prem Real-Time Signage
Some agencies explore low-cost or legacy options before committing to modern on-prem solutions. Understanding trade-offs in reliability, speed, and control helps organizations make informed decisions.
|
Alternative |
Disadvantages |
|---|---|
|
Static Print Signage & Manual Updates |
– Slow response to disruptions<br>- Recurring print costs ($0.50-2 per poster replaced biweekly)<br>- Outdated information remains visible for hours<br>- During emergencies, passengers may be uninformed for 12+ hours |
|
Legacy LED/Flip-Board Systems |
– High maintenance costs ($5K-10K yearly per unit)<br>- Limited to basic info (train numbers/times)<br>- Adding new languages or message types often requires hardware replacement |
|
Cloud-Only Signage Without On-Prem Control |
– Dependent on external connectivity and third-party providers<br>- Compliance concerns for government use<br>- Latency issues during critical alerts<br>- Less control over uptime and integration with internal systems |

Why SignageTube Live is Handy for Government and Public Transportation
SignageTube Live enables agencies to deploy real-time, self-hosted signage infrastructure while using modern content management approaches. By leveraging digital signage and analytics, agencies can become a data-driven organization—treating data as a strategic asset and building capabilities to use that asset for informed decision-making. The platform supports monitoring, proof of play for audits, scheduling, and multi-site control across transit networks, making it easier to collect data that informs operational improvements and enhances transit services.
For government data initiatives requiring data stewardship and accountability, SignageTube Live provides centralized oversight while keeping sensitive systems behind agency firewalls. Data analytics on screen performance help measure reporting requirements and service delivery.
Combining PowerPoint with SignageTube Live for Transit Use
Many public service teams already operate fluently in PowerPoint, making it natural for creating layouts, route maps, and alert templates. SignageTube Live transforms PowerPoint slides into live, data-enriched signage by embedding arrival fields or alert placeholders into designs.
A communications officer can update a disruption notice in PowerPoint and publish it within minutes to all affected station screens. This approach reduces training time, enables rapid design iteration, and maintains consistent branding across city departments.
Benefits Specific to Government and Public Services
Government stakeholders gain transparency through instant incident communication, improved accessibility compliance, and measurable service improvements. Proof-of-play features verify that safety messages and government campaigns ran at required times—valuable for audits and public accountability.
Centralized control coordinates messaging across transit agencies, city hall, and emergency services. Whether announcing fare changes or public health campaigns, organizations maintain consistent communication across their entire signage network.
Practical Tips for Starting a Real-Time Signage Project in Transit
- Start small: Pilot one corridor or line to validate benefits before scaling. A 90-day pilot tracking user behavior can demonstrate 20-30% reductions in passenger complaints.
- Prioritize critical information: ETAs and disruption alerts matter most. Build templates for these first.
- Standardize templates: Create 5-10 core layouts covering departures, alerts, wayfinding, and PSAs. This enables efficient maintenance across your network.
- Involve accessibility early: Test high-contrast designs and multilingual messages with actual users before deployment.
- Build content calendars: Plan government messaging (safety week, fare changes) alongside operational content.
- Test with passengers: Researchers suggest gathering feedback on message clarity before network-wide rollout.
SignageTube offers trial access so teams can experiment before committing to full deployment across their systems.
Conclusion: Building Reliable, Passenger-Centric Transit Communication
Modern public transportation systems depend on clear, real-time communication as much as they depend on tracks and buses. Poor information costs ridership; strong communication builds trust and connect communities to essential services.
On-prem real-time digital signage offers the control, security, and integration depth that government-run networks require. SignageTube Live, combined with PowerPoint, lowers barriers to professional transit signage for agencies of any size.
Consider starting with a small pilot to validate benefits before network-wide rollout. Explore SignageTube’s real-time signage capabilities to see how your transit agency can deliver reliable, passenger-centric communication.